|  |
Groundwater Quality Reports
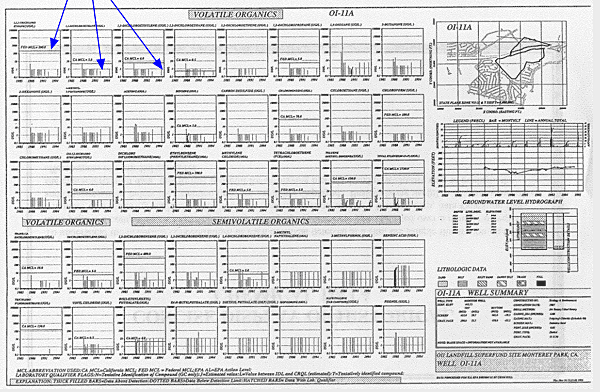
Historical Chemical Data Display of a Monitoring Station (Reduced copy of 11"x17" plot)
with location map, precipitation data, hydrograph, geology, well construction,
regulatory limits, and other relevant information.
Regulatory Limits

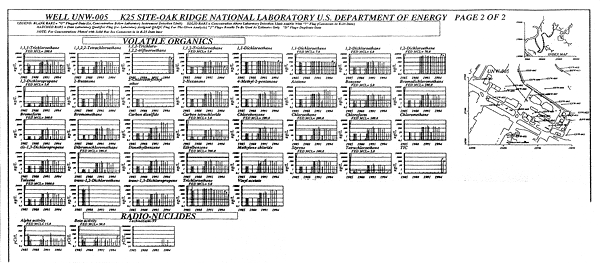
Reduced Copy of DOE K-25 Site MOnitoring Station Data Plot

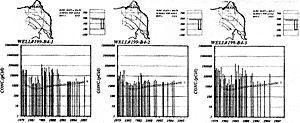
Illustrative 3 plots of tritium PcI/L) monitoring data of DOE Hanford Site
Our tools generated plots of all 900 tritium well monitoring stations. Each plot includes Observed Concentration, well location map, and well depths. The plots also include simulated results (open circle dots)

|


